How to use e-scope 3-in-1 (Ver2.3)
Three tools (oscilloscope, FFT analyzer (spectrum analyzer), signal generator) are included in the e-scope 3-in-1.
It can observe the frequency characteristics of audio devices using an FFT analyzer and a signal generator.
Observation of frequency characteristics in real time is possible by using the ‘FFT synchronization sweep mode’.
Please take a look at this video.
In addition, by purchasing additional “automatic measurement add-on”, the following features will be enabled.
Performance measurements for audio amplifiers.
* Gain frequency characteristics.
* THD vs. output level.
Automatic measurements will be enabled.
More info on the link below
More info on the link below
(How to use Auto measurement option)
Please check it out!.
-Oscilloscope
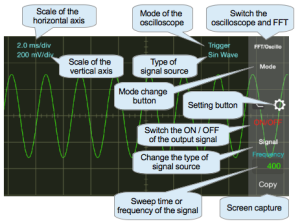
Unit of horizontal axis is ms/div, which shows time per division.
Unit of vertical axis is mV/div, which shows voltage per division.
However, please read them as relative sensitivity in case of microphone inputs.
Changing time scale and sensitivity is possible by pinching fingers.
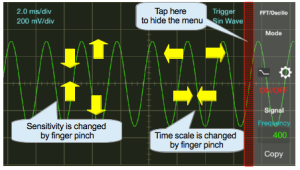
You can switch to full-screen mode if you hide the menu.
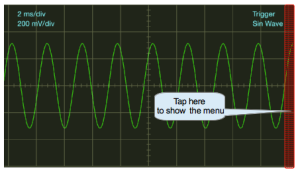
The oscilloscope of ‘e-scope 3-in-1′ has three modes.
- Normal mode (basic mode):This mode is suitable for observing music waveforms.
- Trigger mode: This mode is suited to measure repeated waveforms such as sine wave, You can observe waveforms in stationary condition.
Trigger level is set to 8% of the screen display. Display is not updated when the signal is below this level. - Single mode: This mode is suitable for observing one-time waveform such as impact sound.
When you switch to the mode, it waits for input as shown in the figure below.
You can neither change the time scale nor sensitivity in this state.
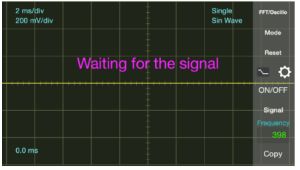
- If there is a signal input, a waveform is displayed in yellow color.
The recorded waveform can change the size of the waveform and time axis by the “finger pinch”.
Further, in a state when time axis is enlarged, the start time in the display can be changed by swiping left and right.
To enter the waiting mode again, please press the Reset button.
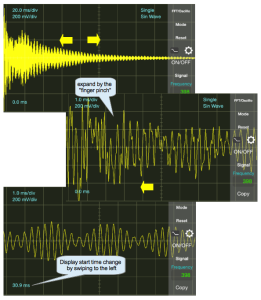
The recorded waveform will be cleared when you exit the application or change the mode.
You can take a screen capture by pressing the Copy button.
-FFT analyzer
It is possible to analyze the frequency spectrum of an input signal.
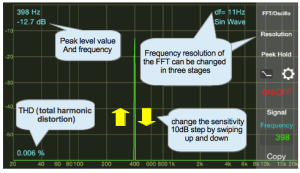
The peak level and the frequency are displayed at the top of the screen. The display can also be used as a simple frequency counter when you enter a single signal.
In addition, the THD (distortion) value is displayed at the bottom left of the screen.
By pressing the resolution button, you can select the frequency resolution from three types.
You can change the sensitivity in 10dB steps by swiping up and down.
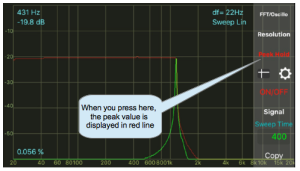
When you press the peak hold button, the maximum value of the signal that you are currently viewing is displayed in a red line.
If you want to clear the preserved results and try again, please press the peak hold button twice.
The above figure shows the frequency response of the swept signal with a hold function, which takes very long time to measure.
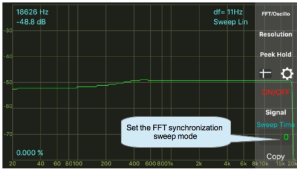
As mentioned above, it is possible to measure the frequency response in real time if you use the FFT synchronization sweep mode of the application program.
Below is an example image of the FFT synchronization sweep mode.
-Signal generator
The signal generator can be used to generate a signal of four types:
Sine wave of 1Hz to 20kHz, White noise, Linear sweep and Log sweep ranging from 20Hz to 20KHz.
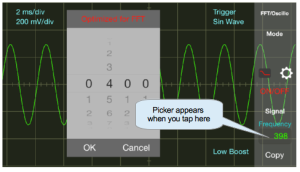
When you tap the area that displays the frequency or sweep time range, a picker will appear. Please set appropriate numbers in it.
By using the mode [optimized for FFT], it can automatically change to a frequency with the highest FFT accuracy.
Please use the feature if you want to accurately measure the THD.
While the frequency is displayed, entering 0000 will be ignored.
During the FFT synchronization sweep mode, when you enter 0000 as the sweep display start time, the FFT synchronization sweep mode will be activated. It will change the frequency at high speed in FFT analysis unit time (less than 0.1 seconds).
In this mode, it is possible to observe the frequency characteristic in real time.
When you press the Copy button at any mode, you can capture screen and save it to a camera roll.
-Cursor feature.
You can display the cursor in the oscilloscope mode and FFT mode.
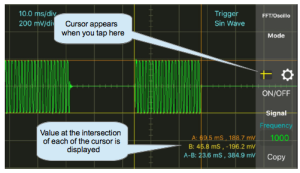
The cursor will appear when you press the cursor button. And you will be able to move the orange cursor A.
Intersection of the cursor will move to the position you have tapped.
If you want to fine-tune the position of the cursor is not releasing the finger from the screen, please slide.
When you press the cursor button again, you will be able to move the yellow cursor B.
Cursor display will disappear when pressed again the cursor button.
Is in the lower right corner of the screen displays the value of the coordinates of the intersection of the cursor.
In addition, the difference between the cursor A and the cursor B is also displayed.
-Changing the background color
When you press the Settings button, the screen will be displayed as shown in the figure below.
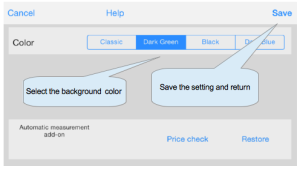
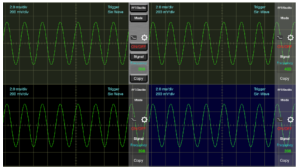
You can select from three types for the background color.
In addition, if you select Classic, three-dimensional buttons will be displayed.
Additional Notes:
- Sampling frequency of the app is 44.1KHz.
- Since the sampling frequency is low to use as an oscilloscope, waveform distortion is noticeable at higher frequency.
- The number of samples in a single FFT frame is one of the tree (4096,2048, or 1024) which can be switched with the resolution button.
- Window function for the FFT is rectangular (with no filtering).
- This app supports “built-in microphone”, “built-in speaker”, “headphone output”, and “microphone connected to the headphone jack.”
- 4-pole mini plug cable is required to connect to an external amplifier headphone output jack.
- When connecting to an external amplifier headphone output, in order to prevent damage to the speakers, etc., please keep the both volumes always low and increase the volume gradually.
- How to make external cable for e-scope 3-in-1
Hi Friend.
I am a e-scope’s user, i think that it is a great app.
I want to give you my knowledge about it, usually a need to know the time between diferent points on sceen, i use for this the time/div, but when i need precision is a little difficult, so, i suggest you add the tipical two measure bar (rod).
Thank you very much