Please look at this video for an overview.
How to buy automatic measurement options.
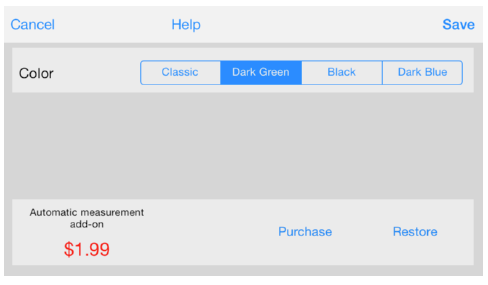
The following figure shows the configuration screen of the e-scope 3-in-1.

Please press the Price Check button first.
Then price will be displayed as shown in the figure below, please press the buy button.
Then purchase confirmation dialog box will appear as shown in the figure below, please complete the purchase by pressing the “buy” button.

Purchase is completed, the menu screen as shown below will be displayed.
When you measure, please use the external input cable as shown here.
(1)Measurement of the frequency characteristics
Connect the output terminal of the external input cable to the input of the amplifier to be measured, connect the input terminal of the external input cable to the output of the amplifier.
In the FFT mode or oscilloscope mode, turn ON the SG in the sine wave output setting of 400Hz ~ 1kHz range.
Please adjust the output measurement level by increasing the volume of iPhone gradually.
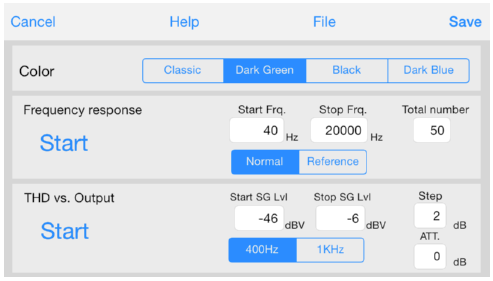
Next, please press the setting button.
Set the measurement start frequency, end frequency, and the total number of measurements.
Please select the [Normal] mode.
When you press the measurement start button, the screen will switch to the FFT mode, and measure the level by changing the frequency.
You can also cancel the measurement by pressing the stop button during the measurement.
When the measurement is completed, it then automatically shifts to the graph display screen by way of the file management screen.
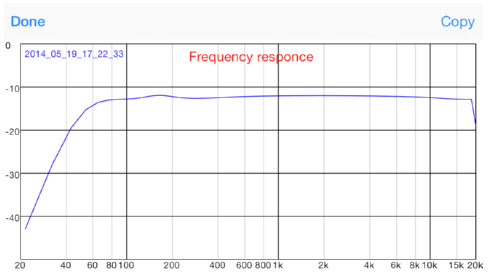
Please press the done button when you see the graph.
Then it changes to the file management screen.
Let us explain in detail later how to use the file management screen.
Press the done button again to return to the FFT screen.
Please connect to the input of the amplifier input terminal of the external cable now.
And press the setting button.
Then press the measurement button after selecting the [Reference].
When the measurement is completed, please move to the file management screen by pressing the Done button.
Place check marks in both as shown in the figure below, please press the graph button.
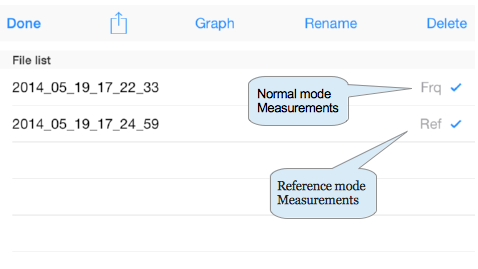
This graph shows the difference between the measured data of the Reference mode and the measurement data of the Normal mode.
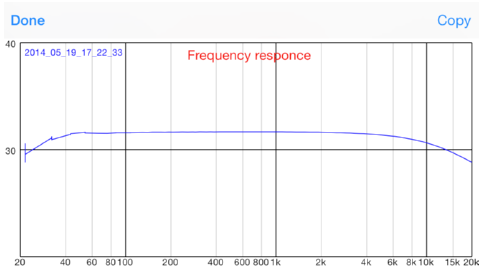
Calculate the gain of the amplifier by taking the difference between the input and the output.
It is possible to cancel out the effect of the frequency characteristics of the headphone amplifier and the built-in microphone amplifier of iPhone.
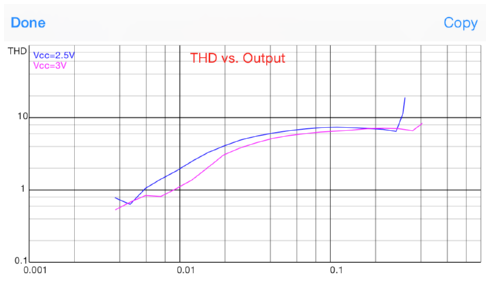
(2)THD vs. output level
If the output of the amplifier to be measured is greater than 1Vrms, you will need to enable the attenuator of the external input cable.
If the input volume is attached to the amplifier to be measured, with minimal volume and then to maximize the volume of iPhone.
If the volume is not attached to the amplifier, please minimize the volume of iPhone.
Connect the output terminal of the external cable to the input of the amplifier, connect the input terminal of the external cable to the output of the amplifier.
In the oscilloscope mode, in the sine wave output setting of 400Hz ~ 1kHz range, turn ON the SG.
Then gradually increase the volume of iPhone or volume of the amplifier, and please adjust the level where the output is a little clipped.
Next, please press the setting button.
You need to set measurement frequency (400Hz or 1kHz), start SG output, measurement step, and the attenuation here.
Please keep -6 as the stop value for SG output.It would be good to set the SG output start to 40dB smaller than the SG output stop.
Enter the attenuation of the external input cable.
Please tap the measurement start button when setting is complete.
Then the process moves on to the screen of the FFT mode, and measure the THD by gradually increasing the SG output.
When the measurement is completed, it automatically shifts the graph display screen by way of the file management screen.


(3)File Management
Measurement results are saved as a CSV file.
[Graph]
Graph is displayed by pressing the graph button after selecting the file.
You can simultaneously display up to five files.
[Rename]
Default name is based on the date and the time provided for the file, but you can change the name.
Select the file if you want to change the name, and press the Rename button.
When the input screen below is displayed, please enter a new name.
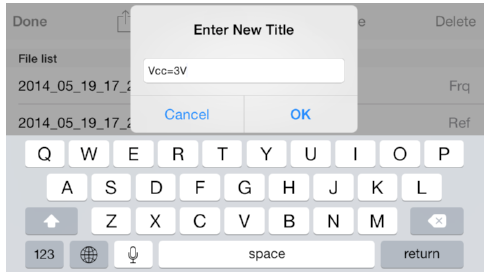
If you change the file name, the title of the graph will be changed as shown in the figure below.
[Delete File]
If you want to delete a file, select the file(s), and press the Delete button at the top right of the screen.
If you press the OK button for the confirmation alert, you can delete the file.
In addition, the delete button will appear when you swipe left to the file name, and it can be deleted when you press there.
[send]
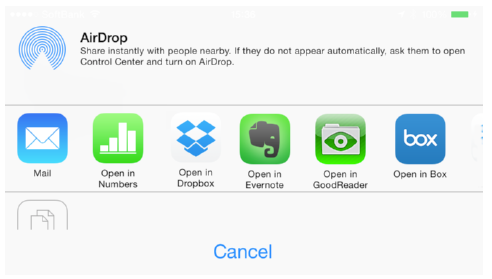
When you press this icon ![]() in a situation that you selected only one file, a list of apps that can handle the CSV file will be displayed as shown in the figure below.
in a situation that you selected only one file, a list of apps that can handle the CSV file will be displayed as shown in the figure below.
When you press ![]() for more than one file, the following menu is displayed, where you can send the measurement data as an email attachment.
for more than one file, the following menu is displayed, where you can send the measurement data as an email attachment.

It is also possible to use the iTunes file sharing as shown in the figure below, to transfer files.
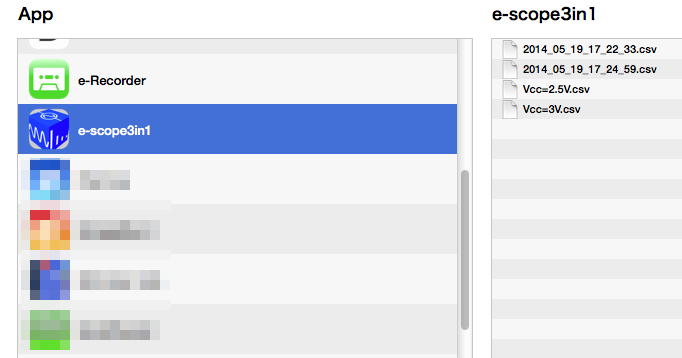
Files that have been transferred are usable for graphing and data processing by excel, etc..
Attention!
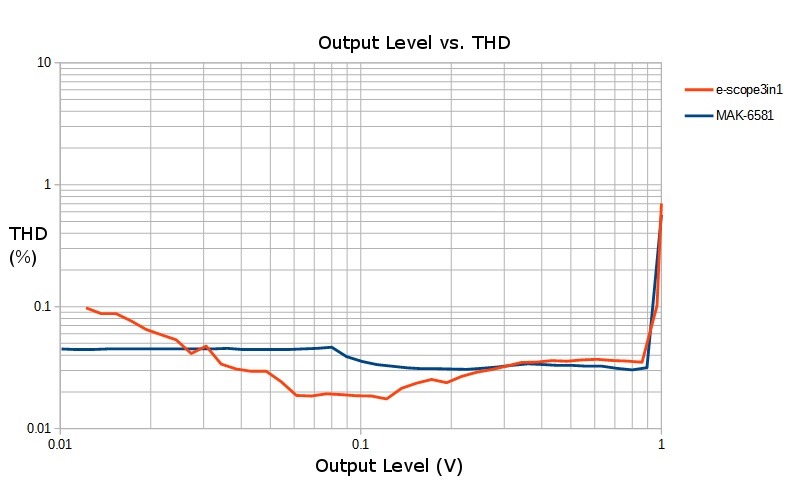
Data measured in this manner is not calibrated.
Please use as a relative comparison for improvement study of self-made amplifier etc.The graph below compares the data obtained by measuring the same amplifier using the AUDIO ANALYZER of MEGURO (MAK-6581) and the “e-scope 3-in-1″.
コメントを残す